US Workers Can Now Buy Five Times More Finished Goods Than in 1971
1971 did not mark the beginning of an overall decline in US standards of living.
The website “WTF Happened in 1971?” highlights a collection of economic charts that purport to show a marked divergence in various economic, social, and financial metrics starting around 1971. The main argument presented on the website is that 1971 was a pivotal year in US economic history, primarily due to US President Richard Nixon’s decision to end the Bretton Woods system by detaching the US dollar from the gold standard. This shift allowed for fiat currency and government-controlled monetary policies, which the site argues led to inflation, income inequality, wage stagnation, and an increased cost of living.
Several economists showed that the actual picture of the post-1971 US economy is considerably less dystopian. In their 2022 book The Myth of American Inequality: How Government Biases Policy Debate, Phil Gramm, Robert Ekelund and John Early calculated that properly measured US income distribution (i.e., one that takes into account taxes and social welfare transfers) is less unequal than was the case all the way back to the late 1940s. Similarly, Scott Winship found that the “pay of the median worker . . . has risen much more slowly since the early 1970s” but noted that “the pay of American workers has tracked productivity trends.” Put differently, American workers continue to be paid what they are worth.
What about the cost of living? Mark J. Perry’s well-known “Chart of the Century” differentiates between budget items that grew more and less affordable over the last quarter of a century. When adjusted for wage growth—prices and wages can increase at the same time—Americans must work more hours to pay for hospital services, college tuition and fees, college textbooks, childcare and nursery school, and medical care services. Conversely, they must work fewer hours to afford housing (yes, you read that correctly), food and beverages, new cars, household furnishings, clothing, cellphone services, computer software, and toys.
Whether the rising cost of education and health care, for example, is due to government-created market distortions or the Baumol Effect (i.e., the phenomenon in which wages in labor-intensive industries with low productivity growth, such as health care or education, rise due to competition for workers with industries that experience high productivity growth, leading to increased costs in the former without corresponding efficiency gains), is subject of much debate. That said, it is good to remind ourselves of productivity gains that can be achieved in markets exposed to domestic and international competition and automatization.
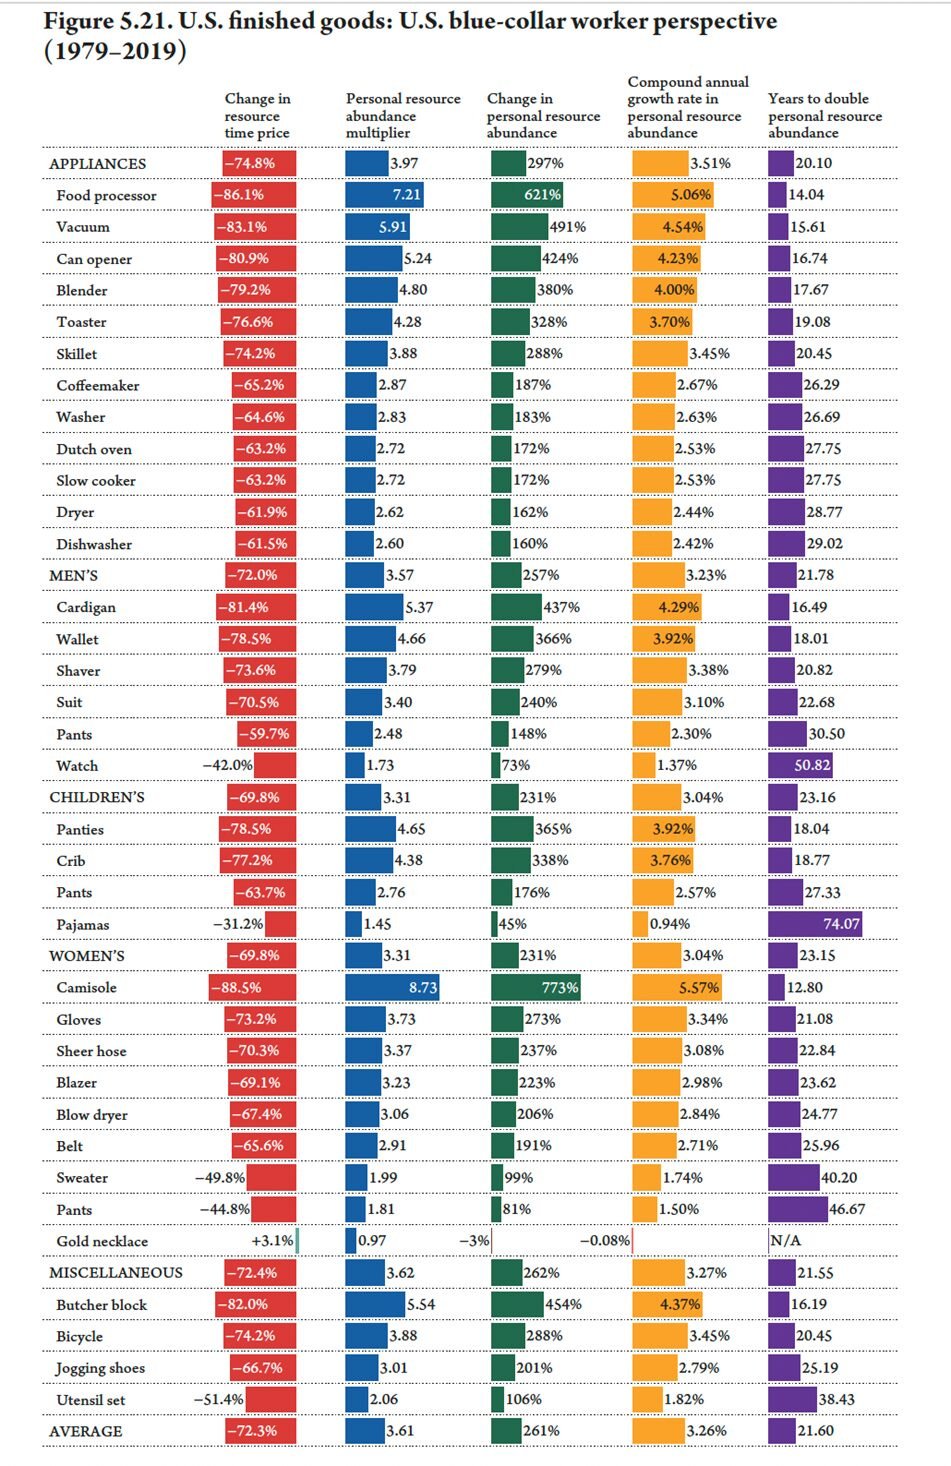
In our 2022 book Superabundance: The Story of Population Growth, Innovation, and Human Flourishing on an Infinitely Bountiful Planet, Gale L. Pooley and I looked at the time prices (i.e., the number of hours and minutes of work an American blue-collar worker has to work to buy something) of a variety of foods, fuels, minerals, and metals. One table (p. 172) is devoted to time prices of 35 finished goods between 1979 and 2019, the average time price of which fell by 72.3 percent. That means that the same length of labor that bought an American blue-collar worker one unit in the basket of 35 finished goods in 1979 got him or her 3.61 units in 2019. The worker’s personal finished goods abundance rose by 261 percent.
Recently, we undertook a similar exercise to ascertain the effect of the recent bout of inflation on the time prices of 75 finished goods between 1971 and 2024. The 1971 data (i.e., nominal prices of 75 finished goods) came from the 1971 Sears catalog. The 2024 data (i.e., nominal prices of similar 75 finished goods) came from Walmart, Macy’s, JCPenney, Kohl’s, Home Depot and Amazon. We divided the 1971 nominal prices of 75 finished goods by $4.26, which was the hourly compensation rate of the average American blue-collar worker in 1971. We divided the 2024 nominal prices of 75 finished goods by $37.15, which was the approximate average hourly compensation rate of the US blue-collar worker in 2024.
We found that the average time price of menswear, childrenswear, womenswear, furniture, appliances, electronics, sporting goods, and power tools and garden equipment fell 80.7 percent. That means that the same length of labor that bought a US blue-collar worker one unit in the basket of 75 finished goods in 1971 bought that worker 5.19 units in 2024. The worker’s personal abundance of 75 finished goods rose by 419 percent. The compound annual growth rate in personal abundance of finished goods came to 3.16 percent, indicating a doubling of personal abundance every 22.31 years. Given that personal abundance rose by 419 percent, while the US population rose only by 62 percent between 1971 and 2024, we can say that abundance rose at a superabundant rate (i.e., faster than population).
Change in Time Price of U.S. Finished Goods: U.S. Blue-Collar Perspective (1971-2024)

Mostly deregulated markets, where production is subject to competition and automatization, can result in substantial reduction in time price and consequent increase in abundance. Let us keep that in mind as the debate over the appropriate level of restrictions on the freedom of the market rages around the world—from the far-flung New Zealand to our own United States.
Author: Marian Tupy, the editor of HumanProgress.org, a senior fellow in the Cato Institute’s Center for Global Liberty and Prosperity, and an author of the book Superabundance: The Story of Population Growth, Innovation, and Human Flourishing on an Infinitely Bountiful Planet.


One quibble, and lot of the compensation increase for workers has been in the value of health insurance. This makes health care more affordable, but means there's less actual money for the basket of goods.