Flying Gets Cheaper as More People Fly
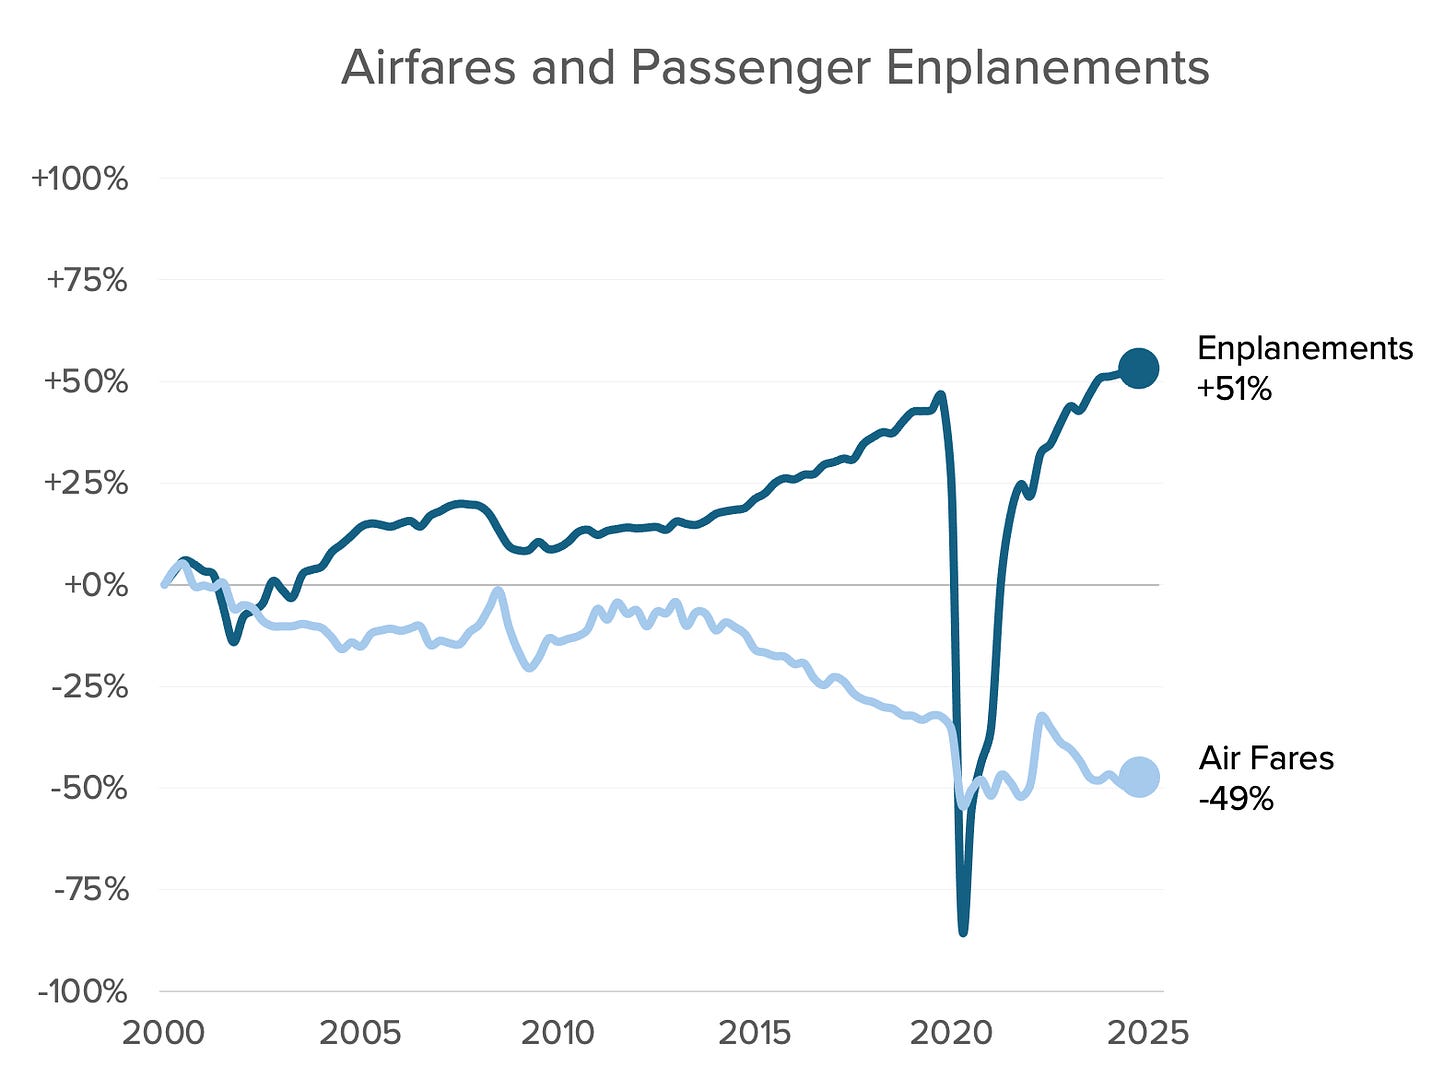
Since 2000, US airfare time prices decreased by 49 percent while passenger enplanements grew by 51 percent.
The Bureau of Labor Statistics tracks airfares while the Department of Transportation monitors enplanements (passenger boardings). Since 2000, the US population grew 22 percent while enplanements increased by 51 percent, and the time price of airfares for blue-collar workers decreased by 49 percent. This means that in 2025, these workers get 2.04 airfares for the same amount of time it took them to earn the money to buy one airfare in 2000, indicating an abundance increase of 104 percent. Every 1 percent increase in population corresponded with a 4.73 percent increase in personal airfare abundance (104 ÷ 22).
The historical chart clearly shows the negative impact of major disruptions – the September 11th attacks, the 2008 financial crisis, and the COVID-19 pandemic policies – on flying.
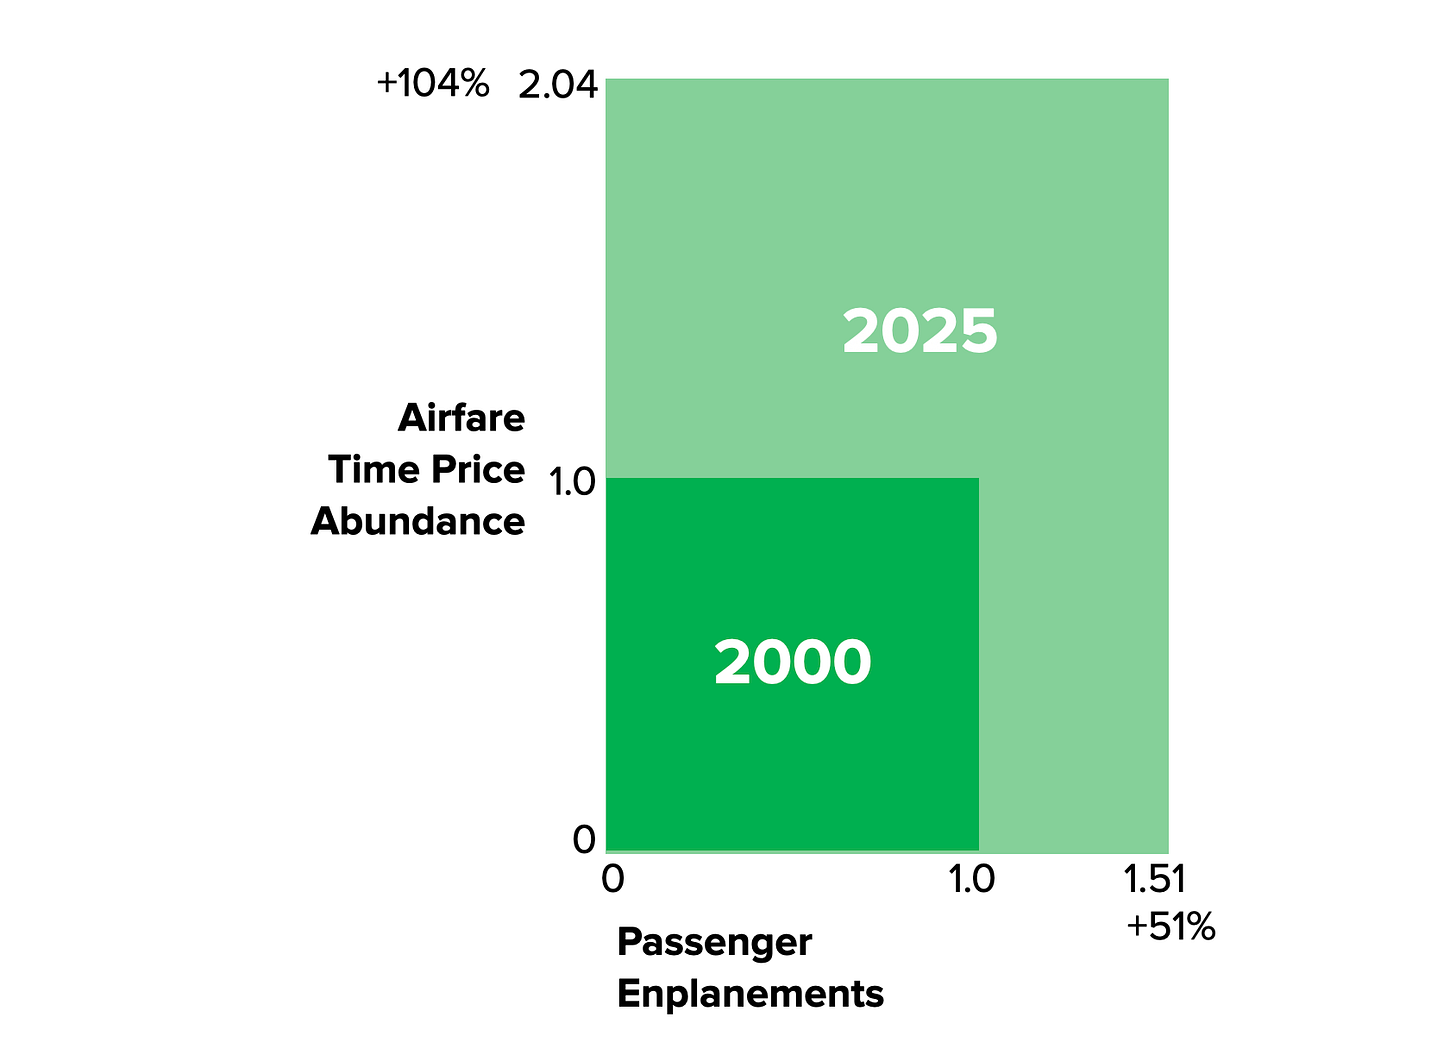
You can also analyze total airfare abundance by combining airfare time price abundance with increased passenger enplanements. To visualize that, we plot airfare time price abundance on the vertical axis and enplanements on the horizontal axis, creating comparative boxes for 2000 and 2025, and then overlaying 2000 onto 2025.
Using 2000 as our baseline (setting both variables to 1.0), the initial box measures 1.0 × 1.0 = 1.0. By 2025, enplanements had grown 51 percent (to 1.51) while airfare abundance increased by 104 percent (to 2.04). The 2025 box therefore measures 1.51 × 2.04 = 3.08.
That represents a 208 percent increase in total airfare abundance over 25 years, equivalent to a compound annual growth rate of 4.6 percent. At this pace, airfare abundance doubles approximately every 16 years. Every 1 percent increase in population corresponded with a 9.45 percent increase in personal airfare abundance (208 ÷ 22).
Tip of the Hat: Maxwell Tabarrok.


